

The Gains Are in the Details: Introducing the Checkout Experimentation Lab


One of our checkout tests looked like a failure.
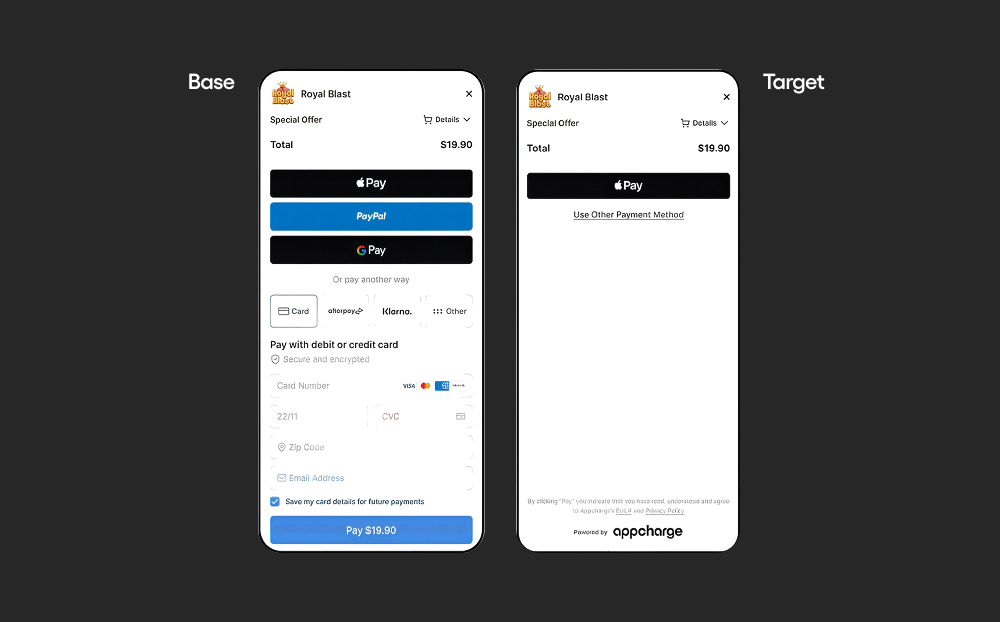
We reduced the number of decisions a player makes at the payment step. The control showed all the main payment methods at once. The variant showed one payment method button and tucked the others behind a link. Across all players, conversion stayed flat and deposit per depositor fell. At the top level, it was a clean no.
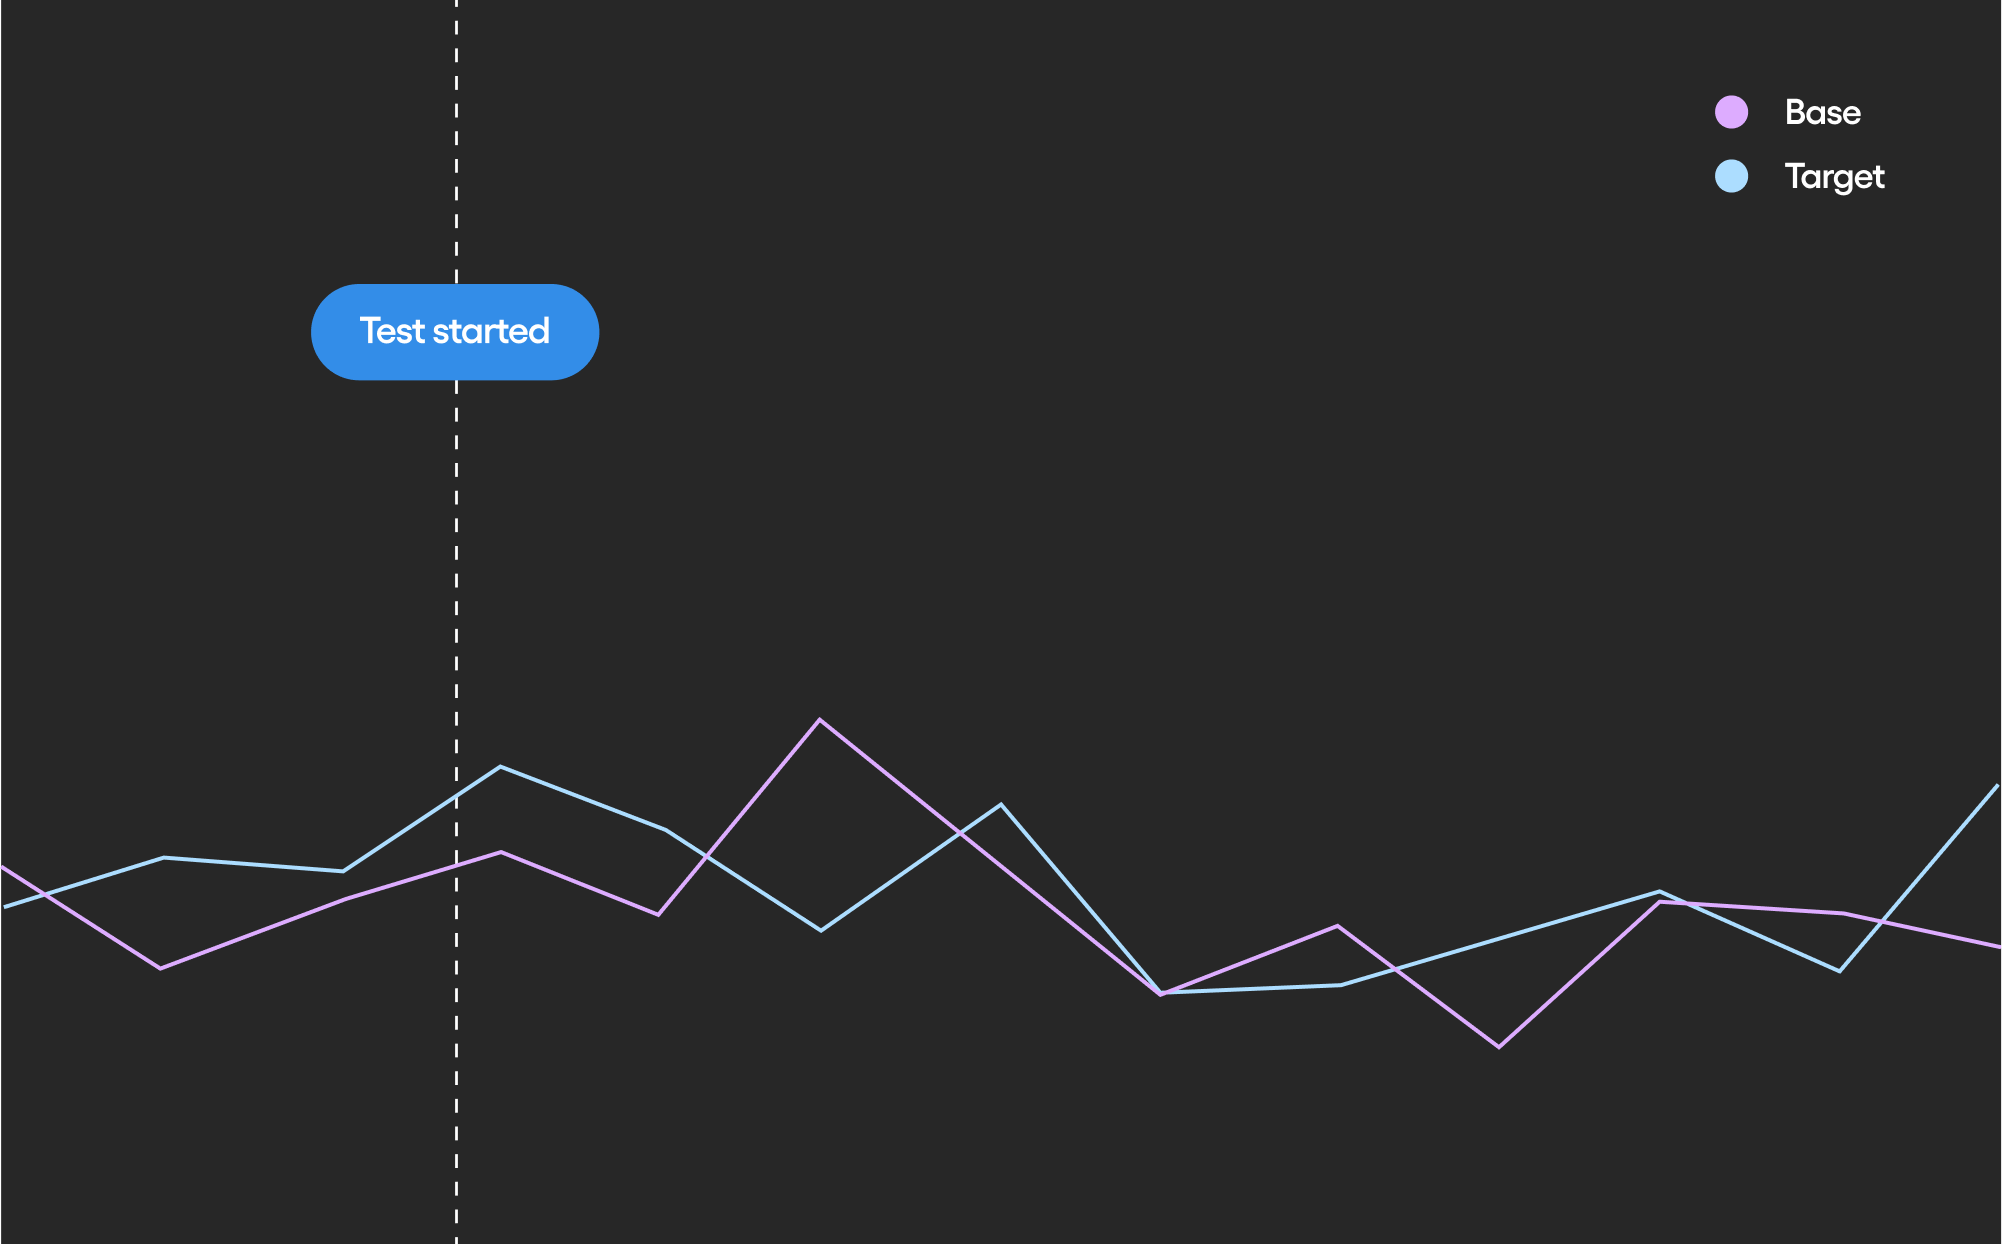
The average was accurate. It was also hiding the story, and finding results like that is what the Checkout Experimentation Lab is for.
Why we ran it
The hypothesis was reasonable, and we had data behind it. In our numbers, 97.7% of players who pay with a given method use that same method at least two more times. If a player already knows how they want to pay, asking them to choose again looks like pure friction.
The research points the same way. Work on choice overload, including Iyengar and Lepper (2000) and Thaler, Sunstein, and Balz (2012), suggests that too many options can make people less likely to choose at all - the paradox of choice. So the assumption was simple: fewer decision points, less churn. We split live traffic and waited for the result.
What the segments showed
So we broke the result down. Among first-time buyers, whose preferred payment method we predicted based on various data points, conversion from checkout open to pay click rose 18.3% in relative terms. Among repeat buyers, it fell 1.4%. A flat average can hold a large gain in one group and a small loss in another.
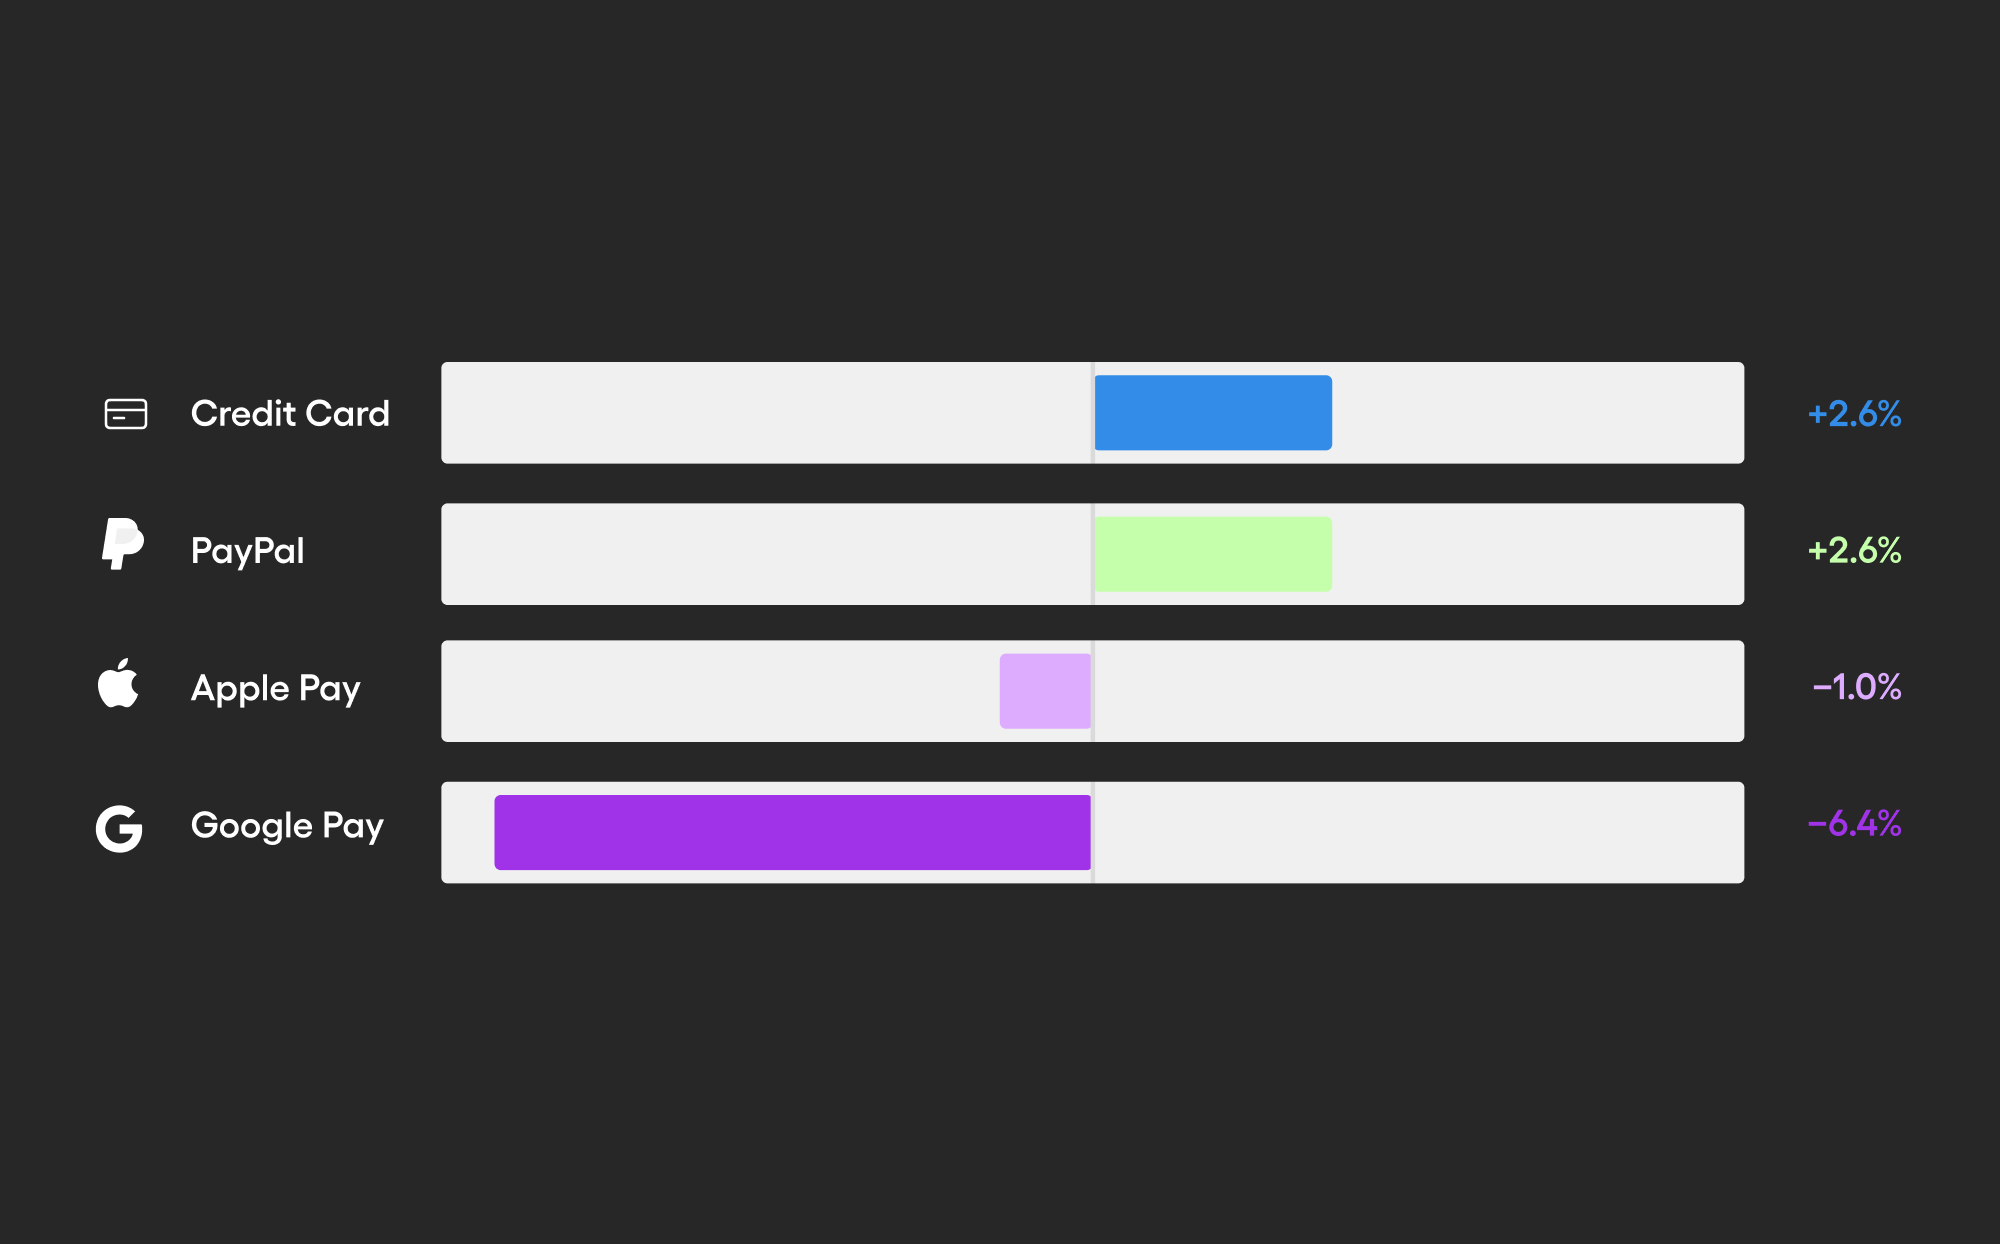
It split again by payment method. The same variant moved conversion +59% in the United Kingdom and -29% in Germany. Among payment methods, credit card and PayPal gained 2.6% each, while Google Pay lost 6.4%.
Two things stayed with me. First, a flat result can hide opposite effects in different groups, so segment it before you accept it. Second, checkout is the most important step in the funnel, and many studios still treat it as a constant. They adapt offers, levels, and prices to each player in real time, but the payment screen looks the same to everyone. That gap is what led us to start testing it in the first place.
What the Checkout Experimentation Lab is
Our Checkout already supported A/B testing, and we've seen how much small, accumulating checkout improvements add up at scale across hundreds of mobile games. The Checkout Experimentation Lab is the next evolution of our A/B testing capabilities.
Small gains compound only when someone keeps testing for them. A dedicated team of designers, analysts, product managers, and engineers runs the Lab to do exactly that.
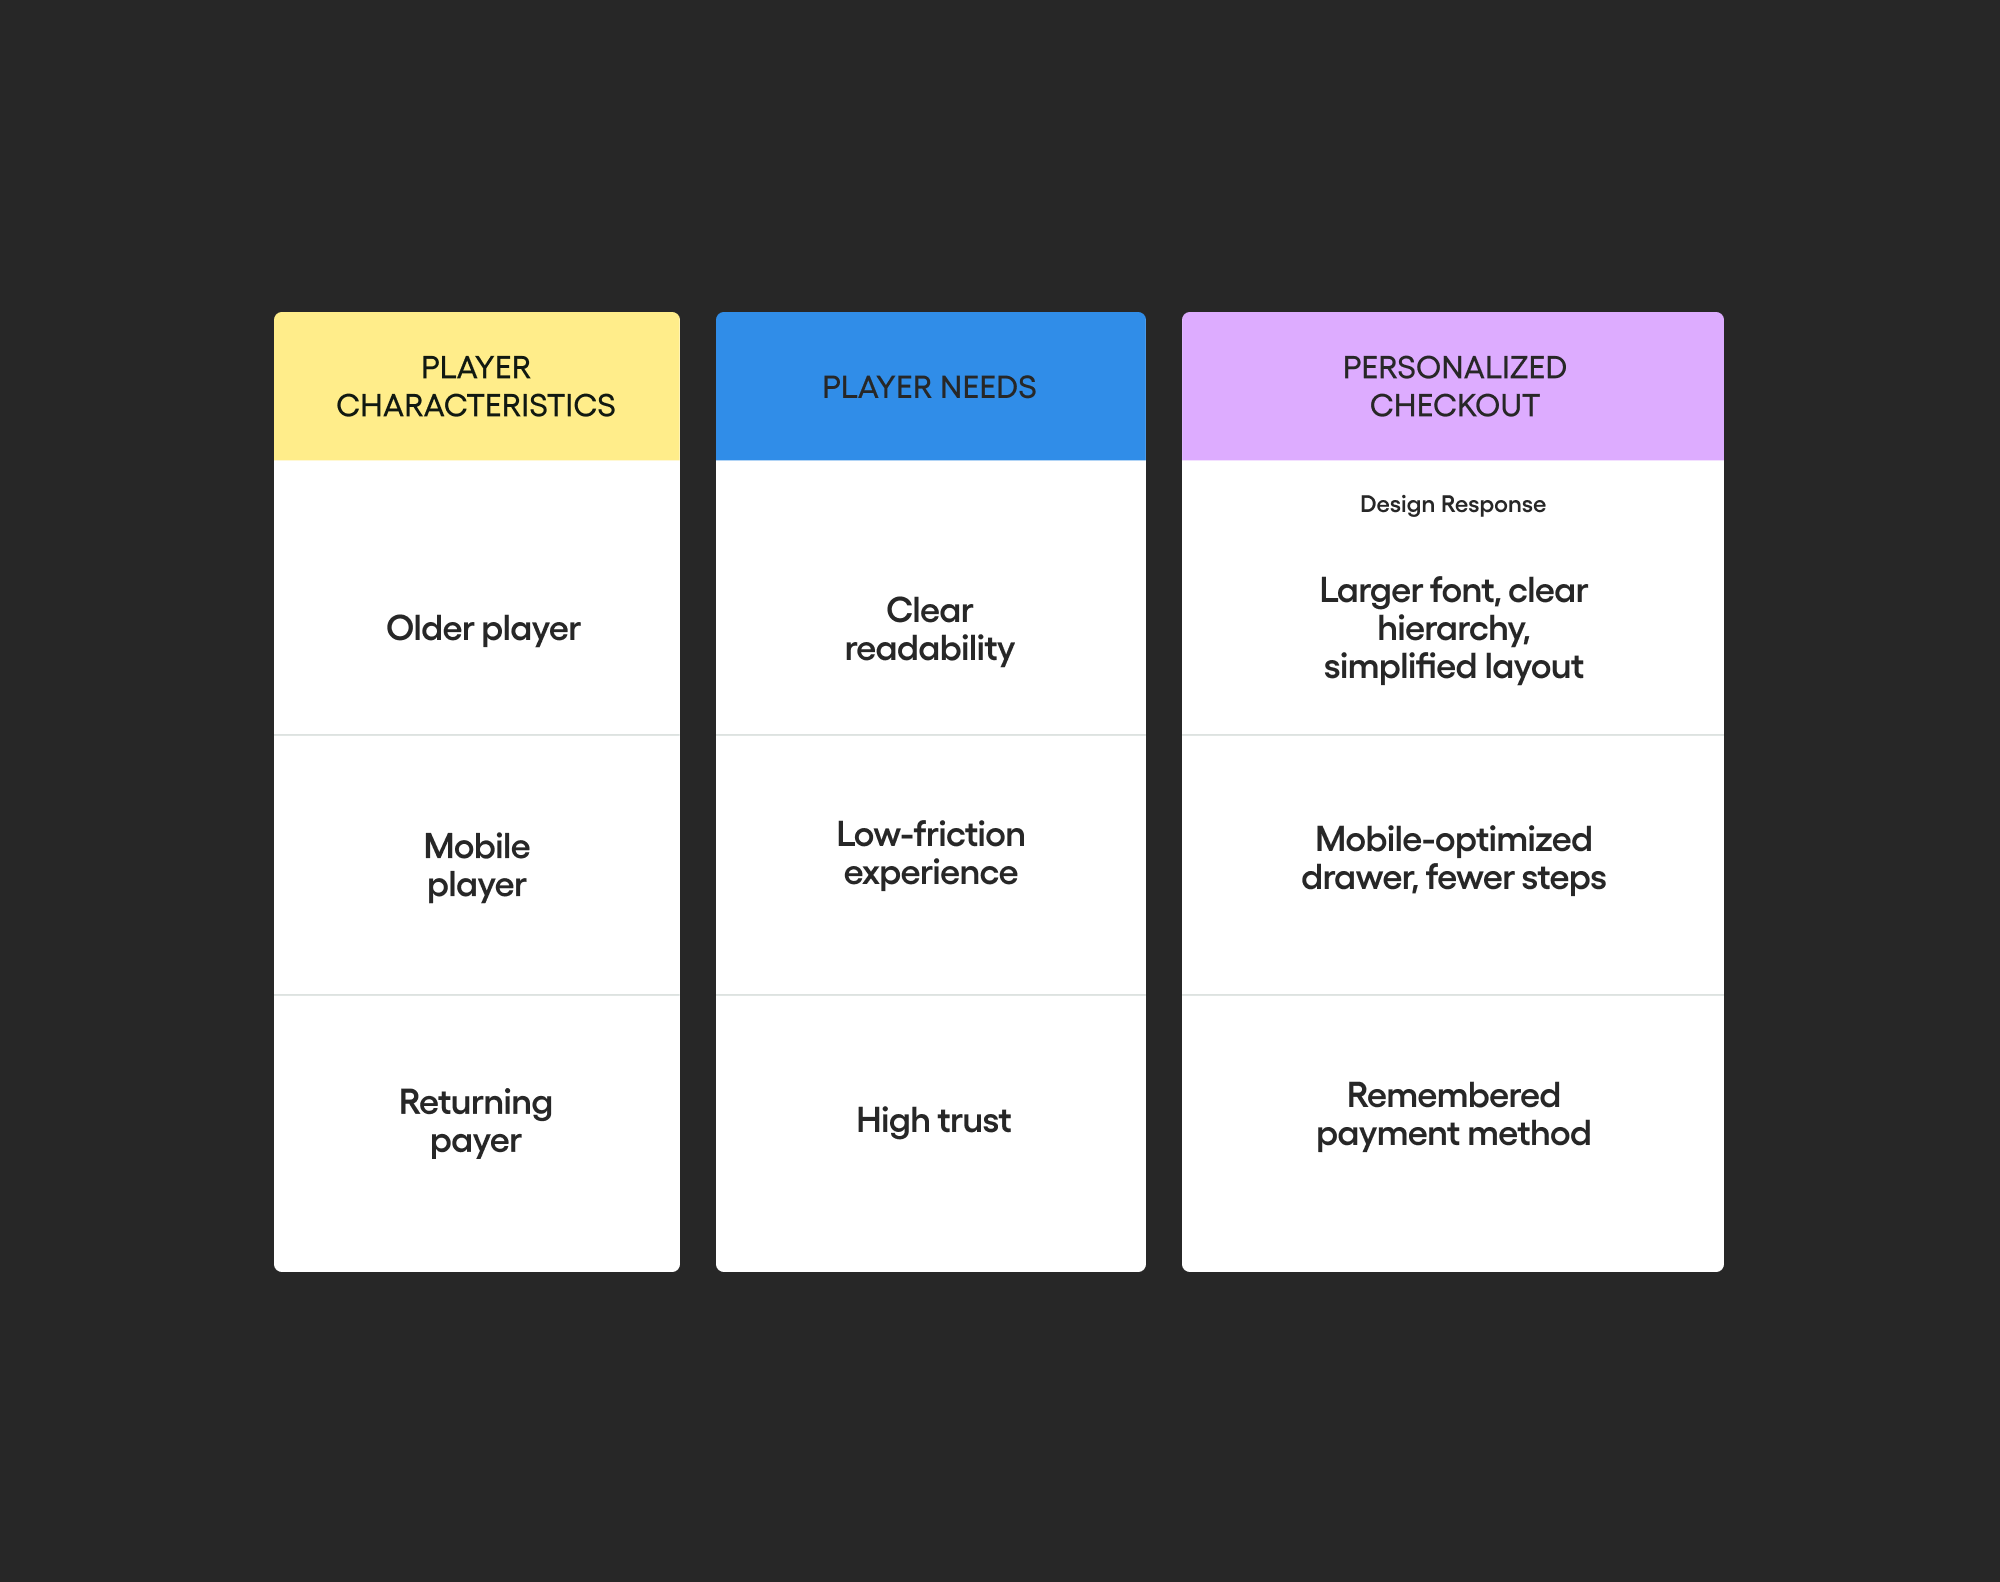
Every test isolates one assumption. The questions are specific: whether to show a promo code field, whether to lead with Apple Pay, whether to preselect a saved card, whether one payment button beats a full list. We run each one on live traffic. When a variant wins, we don't roll it out to everyone by default. We serve it to the segments where it won: first-time or returning buyers, device, country, and payment method.
What it means for partners
Early results from personalized checkout experiences show a 4.2% lift in conversion rate and 3% more buyers. Those numbers sound modest until you apply them to volume. For a single studio doing $300M in annual DTC revenue, a 4.2% conversion lift is worth $12.6M a year, assuming it holds at that scale. Every game has a different player base, so read that as an illustration of the math rather than a forecast.
The more useful point is where the gains come from. They came from small changes, found segment by segment, each one tied to a specific assumption we could test.
Three questions for your own checkout
If you run a checkout, these are worth answering before the next redesign.
- Who is dropping, and why? Segment the funnel by first-time versus returning buyers, device, country, and payment method before you read any test result. An average tells you whether something moved. A segment tells you who moved.
- How many clicks does it take to pay? Count them for a returning buyer with a saved card. Every extra tap asks that player to make a decision again.
- Who is your checkout actually built for? Most were designed for one imagined player. Yours has at least two: the first-time buyer on Android in Berlin who needs a reason to trust the screen, and the weekly buyer on iOS in Ohio who needs it out of the way.
The other half of the payment
Conversion is the front half of a payment. It becomes revenue only when the payment clears, and that depends on routing, retries, fraud screening, and disputes. We work on both halves. The checkout experience drives conversion. Our Merchant of Record service handles the rest.
We treat every checkout design we ship as a hypothesis, and the Lab is how we keep testing it. If you want to see how your own checkout performs by segment, your Appcharge team can walk you through it.


